To new worlds with quantitative spectroscopy

The Vatican Advanced Technology Telescope (VATT) in Arizona at dusk.
Credit: Vatican ObservatoryAstronomers from the Leibniz Institute for Astrophysics Potsdam (AIP) and the Vatican Observatory (VO) teamed up to spectroscopically survey more than 1000 bright stars that potentially host exoplanets. The team presents precise values of 54 spectroscopic parameters per star in the first of a series of papers in the journal Astronomy & Astrophysics and releases all its data to the scientific community. This unprecedented large number of parameters will be essential to interpret the stellar light and find connections between the stars’ properties and their possibly still unknown planets.
Stars tell stories about themselves, and sometimes about their undiscovered planets. Their language is light; it reveals many physical properties of a star: its temperature, pressure, motion, chemical composition, and many more. Researchers analyse the light with a method called quantitative absorption spectroscopy. Telescopes capture starlight and spectrographs break it up by wavelength into a rainbow-like spectrum which is the star’s light fingerprint. When astronomers know these parameters precisely, they can use them to test their theoretical models of stars. This often reveals that the models have some shortcomings, or that observations of stellar spectra are still too imprecise.
But sometimes, it reveals that a star has a surprising story for astronomers. That is what motivated this team to make an ultra-precise survey of possible planet-hosting stars. “Because stars and their planets form together, the question arose whether the existence of certain chemical elements in a stellar atmosphere, or their isotopic or abundance ratios, is indicative of a planetary system,” explains Prof. Klaus G. Strassmeier, lead author, director at AIP and principal investigator of the survey. Astronomers have hypothesized that the amounts of different chemical elements within a star could hint that the star has terrestrial planets (rocky worlds like Earth or Mars), could suggest ages for those planets, and could even provide clues that the star has “eaten” some of its planets. This will need further investigation, and the now released data lay the foundations for such studies.

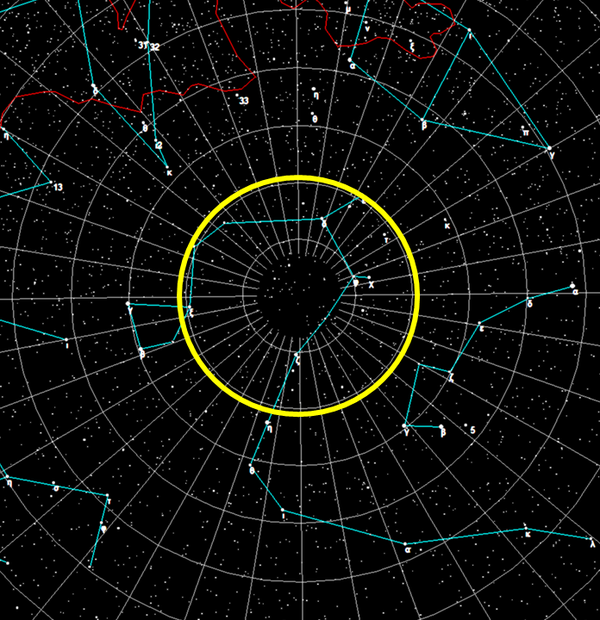
The Northern Ecliptic Pole in the constellation Draco. The yellow circle indicates the VPNEP survey field. Grid lines are spaced at 10 degrees.
Credit: AIP/WikipediaOf the over 5000 confirmed exoplanets (planets orbiting other stars than the Sun), 75% were discovered from space by observing a star’s light being reduced because of a planet transiting in front of it. NASA’s Transiting Exoplanet Survey Satellite (TESS) mission discovered exoplanets just this way. It yielded more exoplanets when observing those parts of the sky furthest from the ecliptic (the plane in which the Earth orbits the Sun), called the ecliptic poles. Observatories in the northern hemisphere can observe the Northern Ecliptic Pole, and this survey of potential planet-hosting stars within this region is named the Vatican-Potsdam Northern Ecliptic Pole (VPNEP) survey.
The survey concentrated on the richest observing field of TESS, an area of the sky approximately 4000 times the size of the full moon. All approximately 1,100 potentially planet-hosting stars in this field were investigated. Up to 1.5 hours of telescope time was required to gather enough of a star’s light to make a single high-quality spectrum. With several visits per star, it took five years to obtain the survey data.
The survey made use of telescopes at two sites: In Arizona, the VO’s Alice P. Lennon Telescope and Thomas. J. Bannan Astrophysics Facility (Vatican Advanced Technology Telescope or VATT) fed light to the Potsdam Echelle Polarimetric and Spectroscopic Instrument (PEPSI) and took spectra of dwarf stars with unprecedented precision. On Tenerife, the AIP’s STELLA (STELLar Activity) Observatory used the STELLA Echelle Spectrograph to capture light of giant stars with lower, but still high, precision.

The STELLA Observatory on the Canary Island of Tenerife. Roofs are open and the two telescopes are ready for observing.
Credit: AIPDr. Martina Baratella, one of AIP’s postdoctoral researchers involved in the survey, comments: “The spectra revealed elements that are among the most difficult to observe.” Abundance ratios like carbon to iron or magnesium to oxygen hint towards the existence and age of otherwise unseen rocky planets. Prof. Strassmeier adds: “While it will take time to fully analyse the data from the survey, we expect soon to announce subsequent discoveries.”
Further information
The VPNEP team:
AIP: K. G. Strassmeier, M. Weber, D. Gruner, I. Ilyin, M. Steffen, M. Baratella, S. Järvinen, T. Granzer, S. A. Barnes, T. A. Carroll, M. Mallonn, D. Sablowski.
VO: P. Gabor, D. Brown, C. Corbally, M. Franz.
More information on PEPSI, STELLA, and the VATT:
https://pepsi.aip.de / https://stella.aip.de/
https://www.vaticanobservatory.org/
Original publication in Astronomy & Astrophysics:
K. G. Strassmeier, M. Weber, D. Gruner, I. Ilyin, M. Steffen, M. Baratella, S. Järvinen, T. Granzer, S. A., Barnes, T. A. Carroll, M. Mallonn, D. Sablowski, P. Gabor, D. Brown, C. Corbally, and M. Franz, VPNEP: Detailed characterization of TESS targets around the Northern Ecliptic Pole. I. Survey design, pilot analysis, and initial data release, A&A 671, A7;https://doi.org/10.1051/0004-6361/202245255
Technical details:
The NEP (Northern Ecliptic Pole) field covers approximately 770 square degrees with approximately 1100 stars brighter than 8.5 magnitudes.
Dwarf star spectra were taken with the VATT and PEPSI with spectral resolution of l/Dl=200,000. Giant star spectra were taken with STELLA and SES with a resolution of l/Dl=55,000.
All optical wavelengths were covered by these spectra.
Survey deliverables include these stellar astrophysical parameters: temperature, gravity, metallicity, atmospheric micro- and macroturbulence, radial and rotational velocity, bisector velocity span, convective blue shift, chemical abundances, mass, and age. Chemical abundances were derived for 27 elements, among them lithium, many refractory elements, and the nuclear fusion moderators CNO. Isotopic ratios were determined only for lithium and carbon. Among the more elusive stellar parameters are the equatorial rotational velocity and the atmosphere’s magnetic activity. The survey not only provides rotational velocities from two different techniques but also the absolute emission line fluxes of these star’s chromospheres, which are well interrelated. Combined with the parameters radius and metallicity, and complemented with the parallaxes from ESA’s Gaia mission, it places tight constraints onto stellar evolutionary models and their physics. Abundance ratios like C/Fe or Mg/O hint toward the existence and age of otherwise unseen rocky planets.
Images

The Vatican Advanced Technology Telescope (VATT) in Arizona at dusk.
Big screen size [1000 x 666, 120 KB]
Original size [2500 x 1667, 400 KB]

The Northern Ecliptic Pole in the constellation Draco. The yellow circle indicates the VPNEP survey field. Grid lines are spaced at 10 degrees.

The STELLA Observatory on the Canary Island of Tenerife. Roofs are open and the two telescopes are ready for observing.
Big screen size [1000 x 255, 40 KB]
Original size [4032 x 1030, 430 KB]

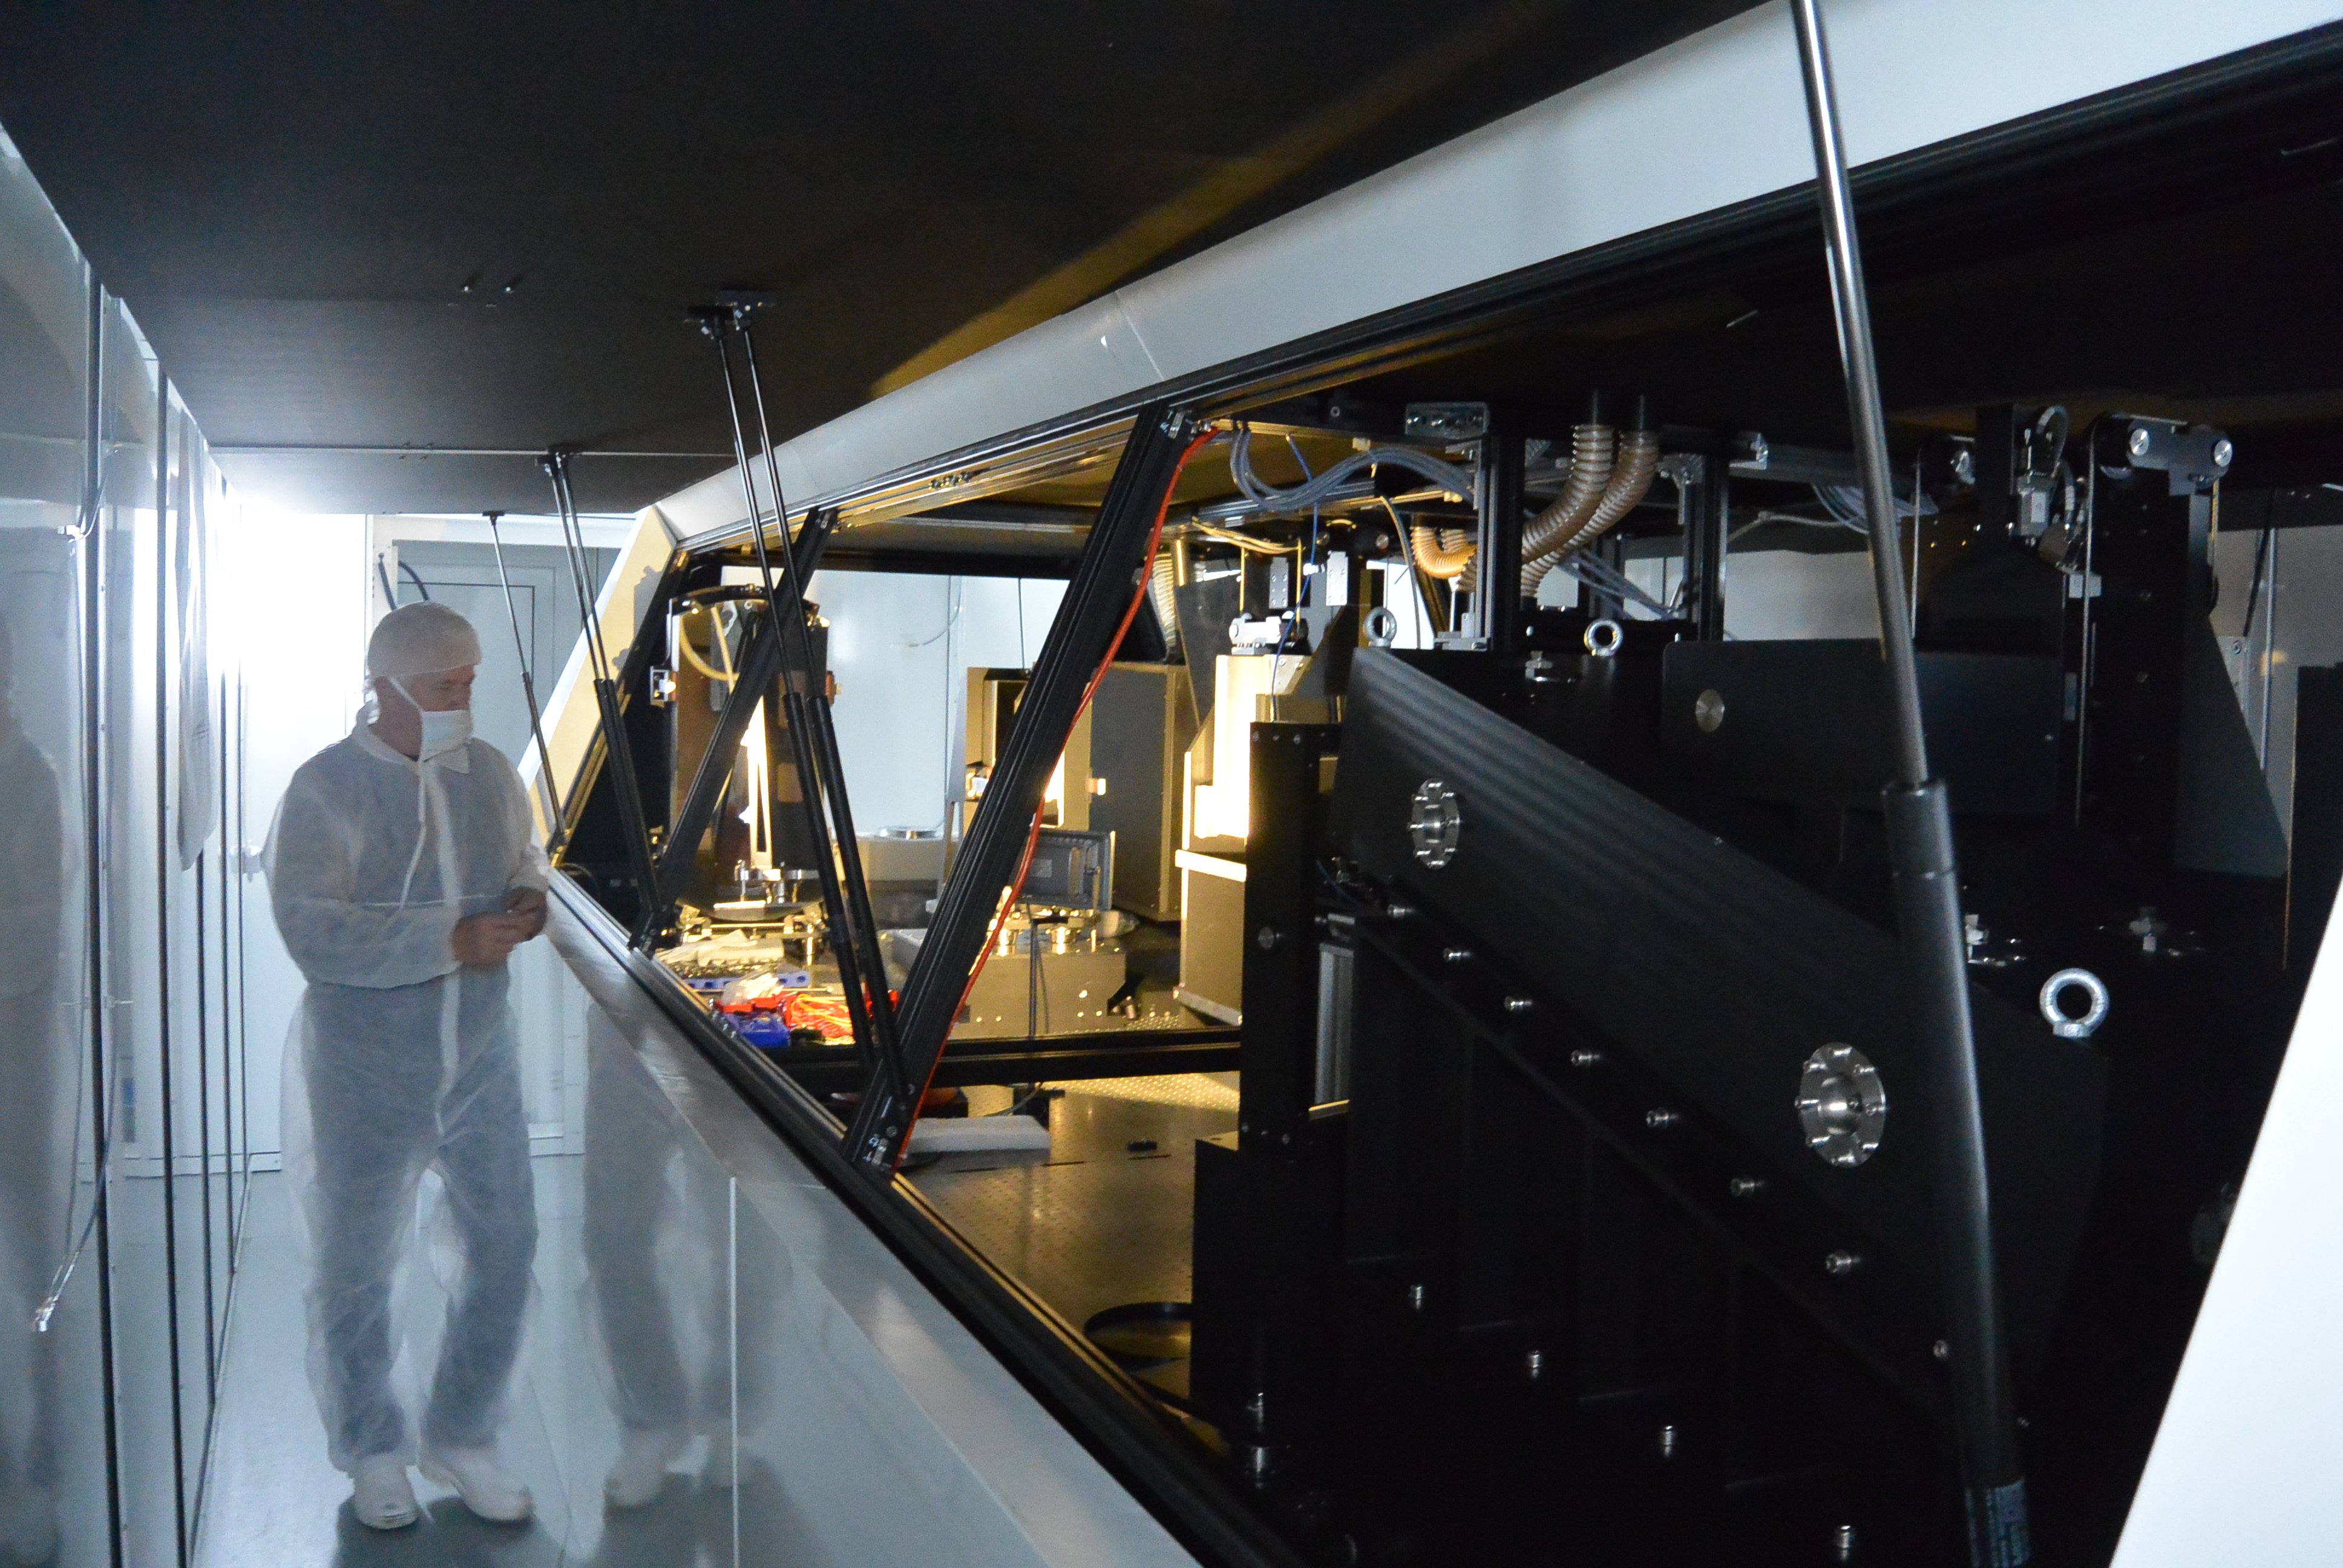
The STELLA Echelle Spectrograph (SES). It is located in the basement of the STELLA building.
Big screen size [1000 x 665, 130 KB]
Original size [2370 x 1578, 550 KB]

The 1.8 m Vatican Advanced Technology Telescope (VATT). The PEPSI fiber-feed unit is mounted in its main focus (image center/bottom). It delivers starlight to the PEPSI spectrograph at the nearby LBT building.
Big screen size [1000 x 669, 140 KB]
Original size [3872 x 2592, 1.3 MB]

The PEPSI spectrograph, designed and built at AIP, in the basement of the observatory housing the Large Binocular Telescope (LBT, one of the world’s largest), located adjacent to the VATT.
Big screen size [1000 x 669, 100 KB]
Original size [3872 x 2592, 1.2 MB]

The 400 m long underground fiber (red line) from the VATT to PEPSI@LBT enables the use of a spectrograph far away from the telescope. The VATT building is on the left side of the image, the LBT building on the right side.

Color-magnitude diagram of the VPNEP survey stars. Position in this diagram indicates stellar mass and age: the lines are evolutionary tracks and are shown for stellar masses given in units of solar mass.
Big screen size [1000 x 981, 340 KB]
Original size [4221 x 4142, 390 KB]

Example spectrum for one of the 1067 survey stars. Relative intensity is plotted versus wavelength in Angstroms (1Å = 10–10 m). Thousands of absorption spectral lines, the “light fingerprint” of the star, are visible. The lower spectrum is a zoom from the box in the above plot. Each spectral line identifies a chemical element with its abundance and ionization status.
Big screen size [1000 x 364, 170 KB]
Original size [3904 x 1424, 100 KB]

